On this page
To debug a Flutter app with AI, the agent needs the same evidence you use: what the screen shows, what the Dart runtime printed, and how Android sees the layout. ScreenSync MCP, a free Model Context Protocol (MCP) server for Android, gives an MCP client such as Claude Code all three from a real phone, so the agent can reproduce a bug, read the error, edit your Dart code and check the fix on the device.
What the agent needs to see
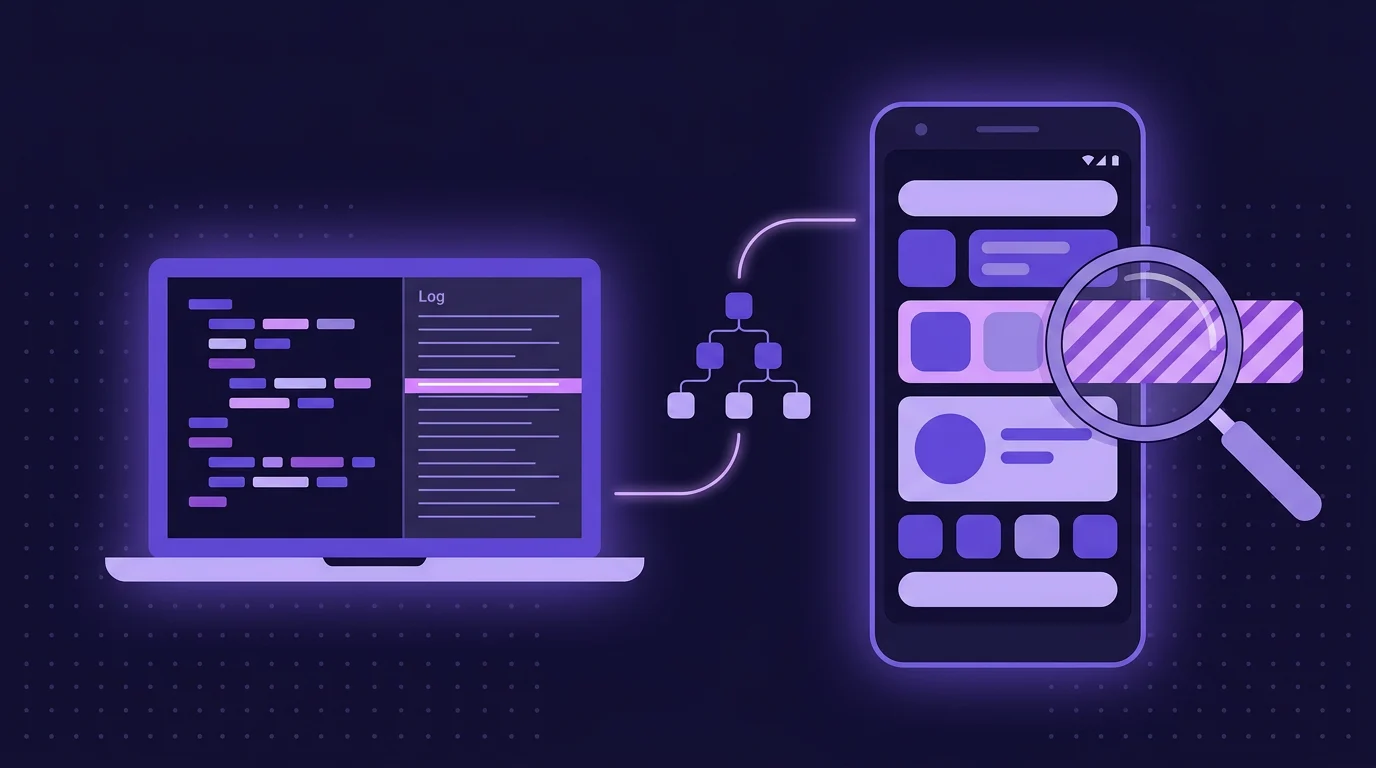
A Flutter bug usually leaves evidence in three places at once. The striped overflow marker is on the screen, the RenderFlex overflowed message is in the log, and the reason a button can't be found is in the semantics tree. An agent that only gets screenshots has to guess at the other two.
ScreenSync's own app is built with Flutter, so parts of the toolset speak Flutter: get_logcat exists to surface Dart errors, and the inspect_latest_mobile_screen prompt asks for the likely Flutter cause of each defect.
| Evidence | ScreenSync tool | What the agent gets |
|---|---|---|
| The screen | control_screenshot, get_latest_screenshot |
Overflow markers, error boxes, clipped text |
| The log | get_logcat |
Dart exceptions, framework errors, print output |
| The layout | get_ui_hierarchy |
Labels, bounds and clickable nodes |
| The change | compare_frames, wait_for_frame |
A before/after pair, or the next phone capture |
| Motion | record_screen, get_recent_screenshots |
A short clip, or the last few captures |
Of the hub's 226 MCP tools, most serve the browser extension; Flutter debugging on a phone uses about a dozen.
Set it up next to flutter run
If flutter run already deploys to your phone, most of the work is done: ScreenSync's control and log tools also use ADB.
-
Download the hub zip from the ScreenSync extension page, unzip it, and start it with
start-hub.baton Windows orsh start-hub.shon macOS and Linux. It needs Node.js 18 or later and prints a pairing QR code. -
Register the hub with your MCP client. In Claude Code it is one command:
claude mcp add screensync node "<HUB_DIR>/screensync-hub.js"If you changed the hub's token from the default
screensync-local-dev, give the server the sameSCREEN_SYNC_TOKEN. Claude Desktop, Cursor and VS Code use the samenodecommand and token in their own config files; the ScreenSync setup guide shows each layout. -
Install the ScreenSync MCP app from Google Play (Android 7.0 or later), scan the QR code and accept Android's screen-capture prompt. The app then sends a frame to the hub over your own network each time you tap its floating bubble, or on a timer if you turn on Live mirror in its settings.
-
Run
adb devices. If it lists more than one entry, such as an emulator and your phone, setSCREEN_SYNC_ADB_TARGETto the phone's serial so the hub drives the device Flutter deploys to. Flutter findsadbthrough the Android SDK, so if it is not on your PATH, pointSCREEN_SYNC_ADB_BINat it. Deploying over Wi-Fi works too; see Android wireless debugging for an MCP server. -
Start the app with a plain
flutter run, which builds in debug mode. Overflow warnings and assertion failures exist only in debug builds, so a release build hides much of what you want the agent to read.
Ask the agent to call control_status and get_device_status before anything else. The first confirms that ADB can reach the phone, which every control_* tool and get_logcat need. The second reports streaming when a phone frame has arrived in the last minute; if it says linked_no_frames, tap the bubble once.
Read Flutter errors from logcat
Flutter writes print and debugPrint output, plus the framework's error reports, to the Android log under the flutter tag. An uncaught asynchronous error shows up as an E/flutter line containing Unhandled Exception. get_logcat reads that log through ADB, so the agent gets the stack trace without you copying it out of a terminal.
The tool takes three arguments: pkg to keep only your app's process, grep for a case-insensitive text filter, and lines (10 to 2,000, default 200). Some typical calls:
get_logcat { "pkg": "com.example.shop", "grep": "flutter", "lines": 500 }
get_logcat { "grep": "overflowed", "lines": 1000 }
get_logcat { "grep": "FATAL EXCEPTION", "lines": 2000 }
Two details save time. First, the grep runs over the last lines lines of the log, not the whole buffer, so on a chatty device raise lines before deciding an error is missing. Second, pkg filters by the process ID your app has at the moment of the call. If Kotlin or Java code in a plugin crashes the app, the FATAL EXCEPTION belongs to the old process, and after a relaunch the filter hides it (if the app is not running, the filter is skipped entirely). For crashes, search without pkg. The Android logcat documentation explains the line format if you want to read raw output yourself.
Show the agent the tree Android sees
Flutter draws its own pixels, so Android has no native view for each widget. What get_ui_hierarchy returns, through uiautomator, is the accessibility tree that Flutter builds from its semantics. Each node carries its text, content description, resource ID, class, clickable flag, pixel bounds and center. The hub drops nodes that have no text and no description and are not clickable, treating them as noise.
That makes the hierarchy a rough accessibility report. An icon-only button without a tooltip shows up as an unlabeled clickable node. control_tap_text cannot find it, because it matches visible text and content descriptions, and a screen reader has nothing to announce either. One change fixes both:
IconButton(
  icon: const Icon(Icons.shopping_cart),
  tooltip: 'Open cart', // becomes the accessible label
  onPressed: openCart,
)
For stable test hooks, recent Flutter versions let the Semantics widget take an identifier, which Android reports as resource-id. A labeled, tappable element can then carry an ID that does not change with the locale; confirm it appears with get_ui_hierarchy before you rely on it. Custom painters with no semantics stay invisible to the tree, so for those the agent reads coordinates from a screenshot and uses control_tap. For more on this trade-off, read why your agent needs the Android UI hierarchy.
A debug loop that works
-
Reproduce. Give the agent the steps, or run the
reproduce_bugprompt with astepsargument. That prompt tells the agent to take acontrol_screenshotbefore each step, act (preferringcontrol_tap_text), check the result withcompare_frames, and readget_logcatafter the last step. -
Collect evidence. A screenshot of the broken state, plus
get_logcatfiltered to your package. In debug builds the framework's error report usually names the widget that caused the problem, with a file and line in yourlibfolder. -
Fix. In Claude Code the agent edits that file like any other code.
-
Reload. Press
rin theflutter runterminal for a hot reload, orRfor a hot restart. On macOS and Linux the agent can do this itself if you start Flutter with a PID file:flutter run --pid-file /tmp/flutter.pid kill -USR1 "$(cat /tmp/flutter.pid)" # hot reload kill -USR2 "$(cat /tmp/flutter.pid)" # hot restartWindows has no such signals, so there you press the key.
-
Verify. The agent takes a fresh
control_screenshotof the same screen and compares it with the one from step 2, then runsget_logcatagain to confirm the error line is gone. When timing matters,compare_framesgrabs two ADB screenshots up to 10 seconds apart in one call and returns both with a coarsechangedRatio. Treat that number as a hint that the screen changed, not as a pixel diff; the images are the proof.
To put the result on the phone, the agent can call publish_inspection to mark the bug regions and publish_patch to attach the diff. In the app's Diagnose tab, tap Fetch latest diagnosis to see the regions as a heatmap over your latest capture, with a Copy Git Patch button for the diff.
Bugs that hide at default settings
Some bugs only appear with a larger font, the on-screen keyboard, or a state that lasts half a second. Each deserves its own pass.
- Large text. Claude Code can run
adb shell settings put system font_scale 1.3from its shell, screenshot each screen, then set the scale back to1.0. Theaccessibility_auditprompt checks for text likely to clip at larger sizes, unlabeled controls, low contrast and tap targets under 48 by 48 dp. - The keyboard. Have the agent tap a text field, type with
control_type, and take a screenshot. A submit button hidden behind the keyboard, or a form that overflows when the viewport shrinks, shows up at once. - Brief states. A loading flash or a dialog that closes quickly usually falls between two screenshot calls, and Live mirror will not catch it either: it pushes one frame every few seconds, 1.5 seconds at the shortest. Use
record_screen, which saves up to 15 seconds as an MP4 through ADB. The clip is solid evidence for you, but check whether your MCP client passes video to the model.
Performance is the exception. Debug builds do not show real frame timing, and screenshots cannot measure it. For jank, run flutter run --profile and use Flutter DevTools.
Limits worth knowing
- Android only. ScreenSync MCP does not support iOS, so bugs specific to the iOS build of your app need other tooling.
- Secure screens. If a screen sets
FLAG_SECURE, Android blanks it in captures. Leave the flag off in debug builds if the agent needs to see that screen. - Typed text is sanitized.
control_typestrips shell metacharacters such as quotes, backticks,$,&,|,;, angle brackets, parentheses and braces before it sends text through ADB, so keep test input to plain characters. - Screenshots reach your model provider. Frames travel from phone to hub over your own network with a bearer token and never reach EpsolDev servers, but any screenshot the agent reads goes to its model provider. Use test accounts and seeded data. The ScreenSync data policy lists where each piece of data is stored.
Next steps
Follow the setup guide to install the hub and pair your phone, then try one prompt on a screen you know is broken: "Take a screenshot, read logcat for my package, and tell me which widget overflows." If you want the wider picture of capture and control first, read what a screen MCP server is. ScreenSync MCP is free while in active development, at app 2.5.7 and hub 1.14.4 as of October 2026.
Next steps
Questions, answered
Can an AI agent see Flutter widgets, or only pixels?
Both, within limits. Screenshots show the rendered pixels, and get_ui_hierarchy returns the accessibility nodes Flutter generates from its semantics tree, including text, labels, bounds and click flags. Widgets without semantics, such as a bare CustomPaint, are missing from that tree, so the agent finds them in the screenshot and taps by coordinates instead.
Do I need a debug build to debug a Flutter app with AI?
For layout and logic bugs, yes. Debug builds keep Flutter's assertions, so overflow messages, the striped overflow marker and error reports that name the faulty widget all reach the screen and logcat. Release builds strip that information out. Switch to a profile build only when you investigate performance, and measure frame timing with Flutter DevTools rather than screenshots.
Does ScreenSync MCP work for Flutter apps on iOS?
No. ScreenSync MCP supports Android phones only, running Android 7.0 or later, because capture uses Android's MediaProjection API and the control tools run through ADB. You can still debug the Android build of a cross-platform Flutter app with it, but bugs that only happen on iPhones need Apple's own tooling or another service.
Can the agent trigger a hot reload after it edits my Dart code?
On macOS and Linux, yes. Start Flutter with flutter run --pid-file, and the agent can send SIGUSR1 to that process from its shell for a hot reload, or SIGUSR2 for a hot restart. Windows has no equivalent signals, so on Windows you press r or R in the flutter run terminal after each edit the agent makes.
Where do my app's screenshots go during an AI debugging session?
Frames move from your phone to the hub on your own network, protected by a bearer token, and EpsolDev never receives them. When the agent reads a screenshot, though, that image goes to the agent's model provider as part of the conversation. Seed test data, sign in with test accounts and close unrelated apps before you start a session.